
Smart Exits
For the complete documentation index, see llms.txt. Markdown versions of documentation pages are available by appending
.mdto page URLs; this page is available as Markdown.
Identifying a good entry is only half the battle. Successful trading requires a disciplined approach to managing your position after it's open. The Trade Management module provides a suite of tools designed to help you plan your exits, secure profits, and control risk systematically.
These tools are automatically activated when a Smart Signal (▲, ▼, +▲, or +▼) appears on the chart, providing a clear visual plan for the entire lifecycle of the trade.
Important: The Smart Exits features (Exit Signals, Take-Profit, and Stop-Loss levels) are designed for Trend Mode only. When using Reversal Mode, Exit Signals are automatically disabled and will not appear on the chart. Take-Profit and Stop-Loss levels will still be plotted when their respective toggles are enabled.
1. Exit Signals
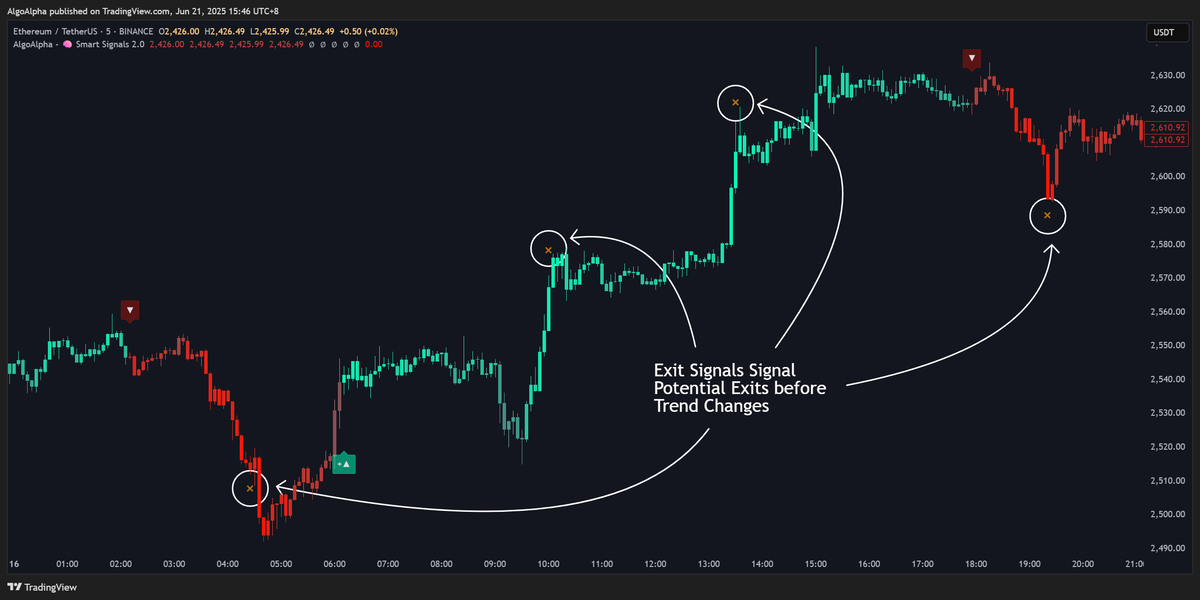
What it is: Exit Signals are automated suggestions for when to close a position. They are not based on fixed profit targets but on changing market conditions. The indicator uses momentum to detect when a trend is likely getting exhausted, signaling potential exhaustion.
Note: Exit Signals are only available in Trend Mode. They are automatically disabled in Reversal Mode.
How to Interpret it:
- Orange 'x' above a candle: This is a bullish exit signal. It suggests that the current uptrend is losing momentum and it may be a good time to close a long position.
- Orange 'x' below a candle: This is a bearish exit signal. It suggests that the current downtrend is losing steam and it may be a good time to close a short position.
How to Use it:
- Primary Exit Strategy: You can use these 'x' marks as your primary signal to exit a trade, regardless of whether your profit targets have been hit.
- Scaling Out: The indicator can plot multiple exit signals. You could use the first 'x' to take some profit off the table and trail your stop-loss on the remainder of the position, waiting for a second 'x' to close it entirely.
Settings:
- Exits Signals: The master switch to turn this feature on or off.
- Max Exit Signals: Sets the maximum number of 'x' marks that can appear for a single trade, allowing for multi-stage exit strategies.
2. Take-Profit (TP) and Stop-Loss (SL) Levels
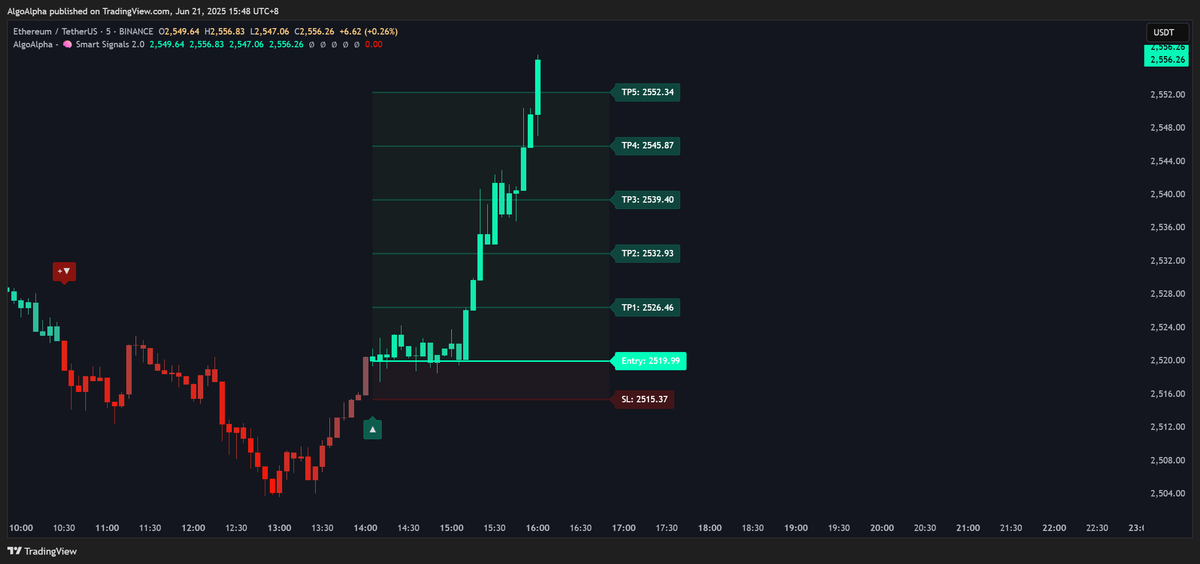
What it is: When a Smart Signal appears, the indicator can automatically project Take-Profit and Stop-Loss levels on your chart. These levels are calculated using a dynamic risk-to-reward framework, creating a clear visual plan for every trade.
How to Interpret it:
- Green/Red Entry Line: Marks the price where the signal occurred.
- Green TP Lines: These are your profit targets. You can have up to 5 levels for scaling out of a position.
- Red SL Line: This is your suggested stop-loss level, representing your maximum risk on the trade.
- Green/Red Zones: The colored zones between the entry, SL, and TP lines provide a clear visual of the potential risk (red zone) and reward (green zone) for the trade.
How to Use it:
- Set-and-Forget Strategy: Use these levels to place firm limit orders for your take-profits and stop-loss with your broker.
- Partial Profits: If you configure multiple TP levels, you can systematically take profits as each level is reached. For example, close 25% of your position at TP1, 50% at TP2, and let the rest run.
- Risk Management: The SL level provides a clear, data-driven point of invalidation for your trade idea. Respecting this level is key to long-term risk management.
TP/SL Distance Type
You can choose how the distance between entry and your TP/SL levels is calculated using the TP/SL Distance Type setting:
- Volatility (Default): Distances are based on the ATR (Average True Range), which adapts dynamically to the asset's current volatility. In volatile markets, levels will be placed further from the entry; in calm markets, they will be tighter. This is the recommended setting for most use cases.
- Percentage: Distances are calculated as a fixed percentage of the entry price. This provides consistent, predictable level placement regardless of market volatility. For example, with a Stop-Loss Distance Multiplier of 1.0 in Percentage mode, the stop-loss is placed 1% from the entry price.
Settings:
- Take-Profit Levels: Enables or disables the plotting of TP lines and the green reward zone.
- Stop-Loss Level: Enables or disables the plotting of the SL line and the red risk zone.
- TP/SL Distance Type: Choose between Volatility (ATR-based, dynamic) or Percentage (fixed percentage from entry).
- Take-Profit Target Count: Sets the number of TP lines to display (from 1 to 5).
- Take-Profit Distance Multiplier: This number controls the distance to your TP levels.
- When Volatility is selected: Acts as a multiplier on the ATR-derived distance. Higher values place targets further away.
- When Percentage is selected: Directly sets the percentage distance from entry. For example, 3.3 means TP levels are distributed across a 3.3% range from the entry price.
- Stop-Loss Distance Multiplier: This number controls the distance to your SL level.
- When Volatility is selected: Acts as a multiplier on the ATR-derived distance. Higher values create wider stops.
- When Percentage is selected: Directly sets the percentage distance from entry. For example, 1.0 means the stop-loss is placed 1% from the entry price.
Agent Instructions
This documentation is published with GitBook. GitBook is the documentation platform designed so that both humans and AI agents can read, navigate, and reason over technical content effectively. Learn more at gitbook.com.
Querying This Documentation
If you need additional information that is not directly available in this page, you can query the documentation dynamically by asking a question.
Perform an HTTP GET request on the current page URL with the ask query parameter:
GET https://algoalpha.gitbook.io/algoalpha-user-manual/premium-indicators/smart-signals-assistant/smart-exits.md?ask=<question>The question should be specific, self-contained, and written in natural language. The response will contain a direct answer to the question and relevant excerpts and sources from the documentation.
Use this mechanism when the answer is not explicitly present in the current page, you need clarification or additional context, or you want to retrieve related documentation sections.